
A 4D report links the construction schedule to the objects of the model, so you can see on the building which phases are on time and which are late. Building one in Power BI usually means preparing tables, writing measures and setting up the 3D viewer by hand.
Vcad already works with AI assistants. Download the template of the model as a Power BI project, add the schedule exported from Navisworks TimeLiner, and let the assistant build the report. No code to write and no connector to install. Everything you need to try it on a sample model is in a free kit.
From the Vcad template to the finished 4D page, in about a minute and a half.
What you need
Four things, all free to start with.
A Vcad account
The free account includes the Samples folder with the Ice Stadium model.
Power BI Desktop
To open the project and see the report with the 3D model.
An AI assistant
One that can read and write files in a folder, such as Claude Desktop or Claude Code.
The kit
The Navisworks TimeLiner export of the Ice Stadium, the objects of each phase and a first prompt. Download (49 KB)
Four steps
About fifteen minutes, most of it talking.
Unzip the kit
Into a folder of its own, for example
C:\Vcad-AI-4D. It holds the two CSV files and the prompt.Download the template as .pbip from Vcad
Sign in, open Samples, select
ice stadium.nwd, click Download template, then Download .pbip. Unzip it into the same folder. A Power BI project (.pbip) is made of text files: an assistant can read and edit it.Talk to the assistant
Open the folder with your AI assistant and paste the prompt below. It looks at the files, links the schedule to the objects of the model, asks you a few questions (reference date, what counts as late, the layout you prefer) and builds the page.
Open it in Power BI
Open the
.pbipin Power BI Desktop and click Refresh. The new page shows the KPIs, the planned vs actual schedule and the 3D model coloured by phase and by status.
The first prompt
Paste it as it is, then answer the assistant’s questions.
This folder has the VCAD Power BI project of the Ice Stadium and two exports of its Navisworks TimeLiner schedule. Build me a page that shows which phases are on time and which are late: a planned vs actual Gantt and the 3D model coloured by phase and by status.
What the report shows
The page the assistant builds answers one question: which phases are on schedule, and where are the late ones on the building. At the top, the KPIs: reference date, phases late, worst finish delay, current phase overdue and share of objects in late phases. Below, a week by week grid with planned and actual dates for each phase, and the 3D model with two colour themes: by phase, to see the construction sequence, or by status, where orange means finished late, red means late and purple means overdue. Selecting a phase in the table isolates its objects on the model.
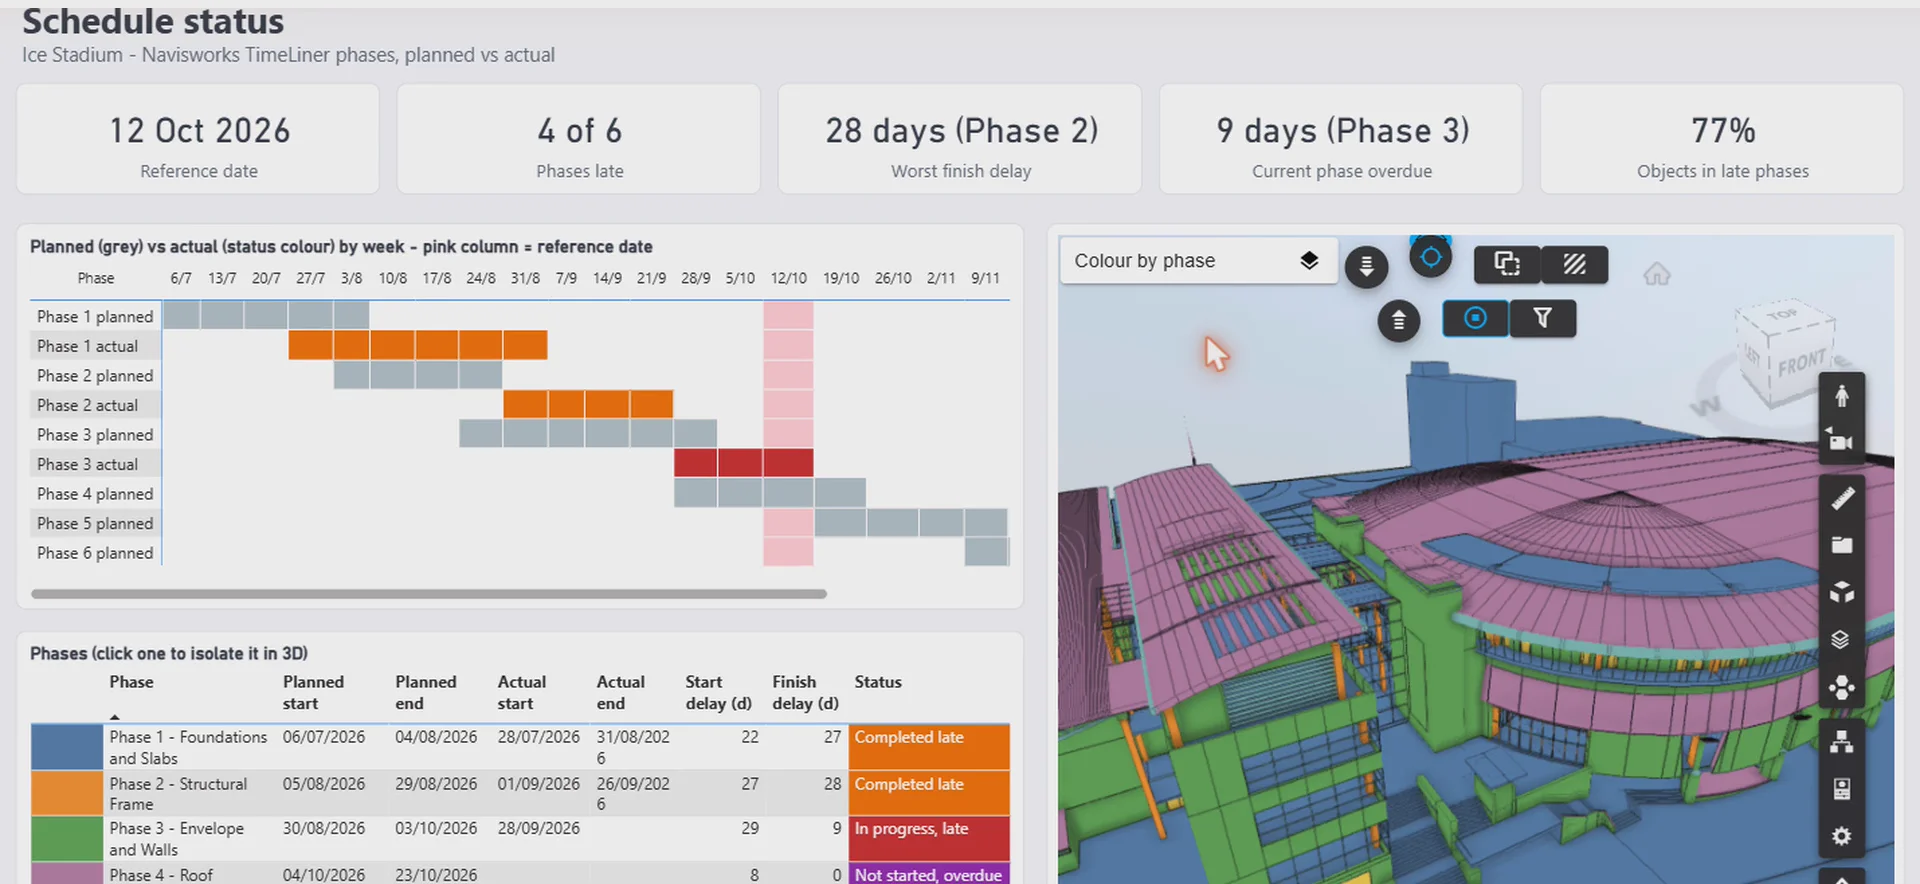
The page built by the assistant: KPIs, the planned vs actual schedule by week, the phase table and the 3D model coloured by phase.
Why it works without a connector
Everything the assistant needs is already in the files.
The Vcad project knows where the data is
- The template holds the address of the model and its key: on every refresh it reads objects and properties live from Vcad. Nothing is copied into the file.
- The assistant reads the same data the same way, so it can check its work on the real model.
- The 3D viewer is already in the template: the assistant only tells it which objects to colour.
What the assistant found in the demo
- 14,608 objects in the Navisworks selection sets, all matched to the Vcad model. With child objects inheriting the phase of their parent, all 19,770 objects with geometry get exactly one phase.
- As of 12 October 2026: 4 of 6 phases late, worst finish delay 28 days, 77% of the objects in late phases.
- A week by week schedule, a phase table and a 3D model with two colour themes, in one page.
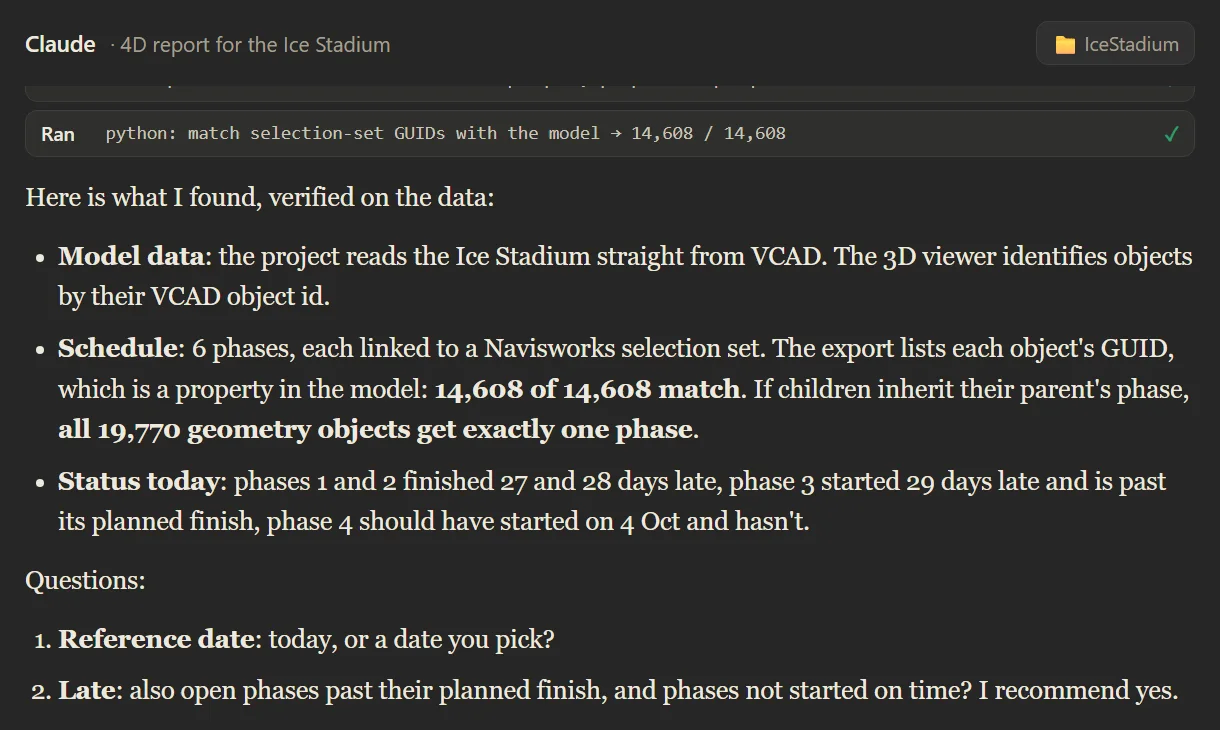
Before building anything, the assistant matches the schedule with the model and asks what to use as reference date and what counts as late.
Use it on your own models
The same steps work on any model in Vcad. Upload the model, download its template as a .pbip and give the assistant your own TimeLiner export. The project contains the key to your model: keep it private, as you would a password.
For other ways to bring time into a Vcad report, see 4D construction from an IFC file and Navisworks TimeLiner data in Power BI, or read our guide to Power BI integration with BIM.
FAQ
No. The MCP server, coming soon, will let AI assistants work on your Vcad models directly. This example shows what is possible today with files alone.
Any assistant that can read and write files in a folder on your computer. We recorded the demo with Claude.
A Power BI project saved as a folder of text files instead of a single binary file. Tables, measures and report pages can be read and edited outside Power BI Desktop, which is what lets an AI assistant work on them.
No. The project contains the address of the model and its key, and reads objects and properties from Vcad on every refresh. That is why it must be kept private when it points to your own models.
Yes. Upload your model to Vcad, download its template as a .pbip and give the assistant your own schedule export.
The project combines a local CSV file with the Vcad data, so Power BI asks how to treat them. For this sample, choose to ignore privacy levels for the file.
Try it on the Ice Stadium
Free account, sample model included.
Prefer a guided tour? Request a demo.
Claude is a product of Anthropic. Vcad is not affiliated with Anthropic.