Importing a Navisworks model into VCAD
VCAD reads Navisworks files (NWD and NWC) natively. With VCAD Standalone, importing these files requires enabling Autodesk Platform Services, which handles reading the format. With VCAD for ACC the workflow is more direct, because files come from Autodesk cloud projects with no additional configuration.
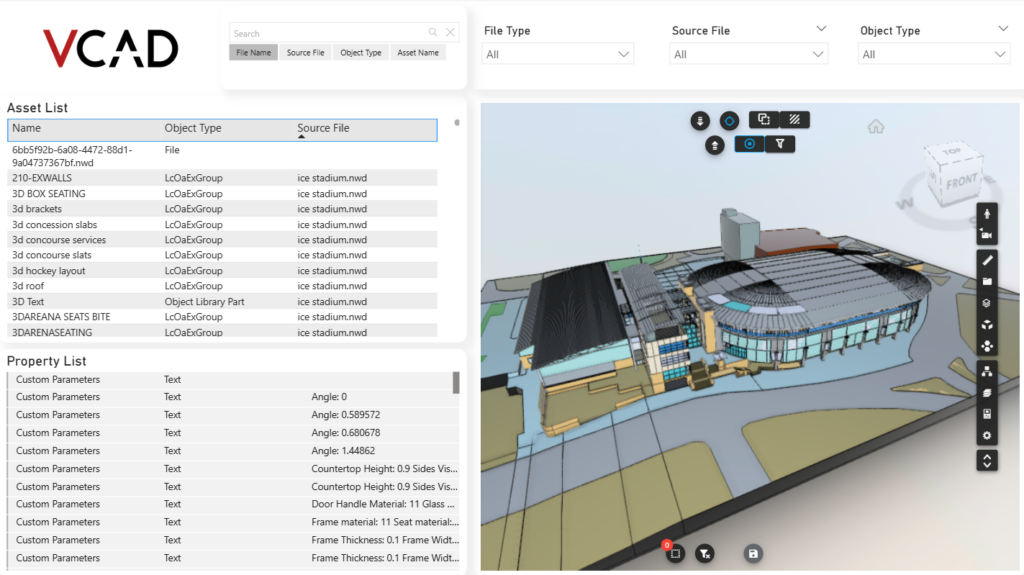
Once the model is imported, VCAD extracts its geometry together with the element properties, so the 3D model and its data are both available inside Power BI.
From model to report in Power BI
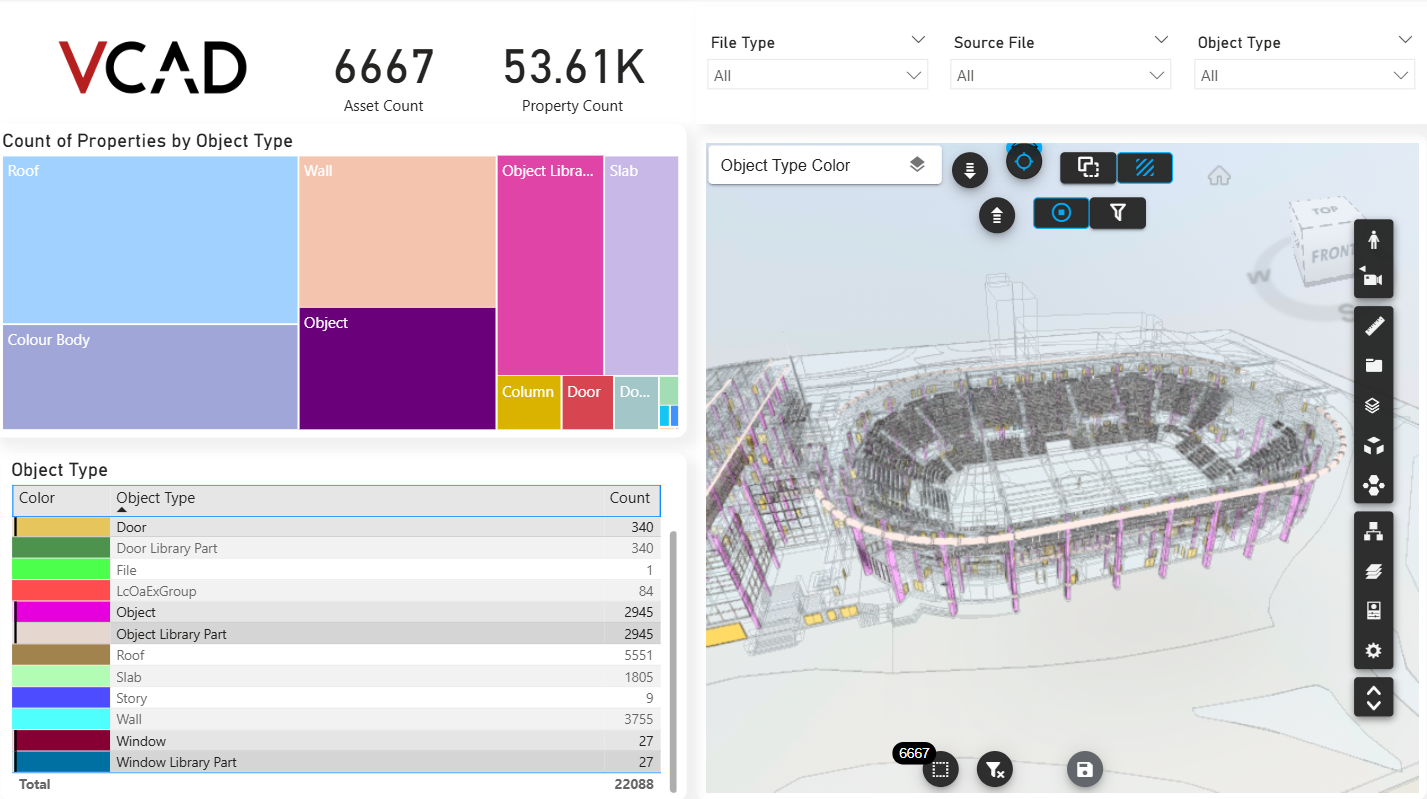
Once the model is loaded, element data becomes regular Power BI tables, ready to use in your reports. The 3D model lives inside Power BI through the VCAD custom visual, navigable directly in the dashboard.
The connection is two-way: when you select a data point in a chart, the matching element is highlighted in the model, and the other way around. You immediately see which part of the model the number you are looking at refers to. Elements can be selected and located in the 3D model directly from the report.
Clash detection and TimeLiner, ready to use
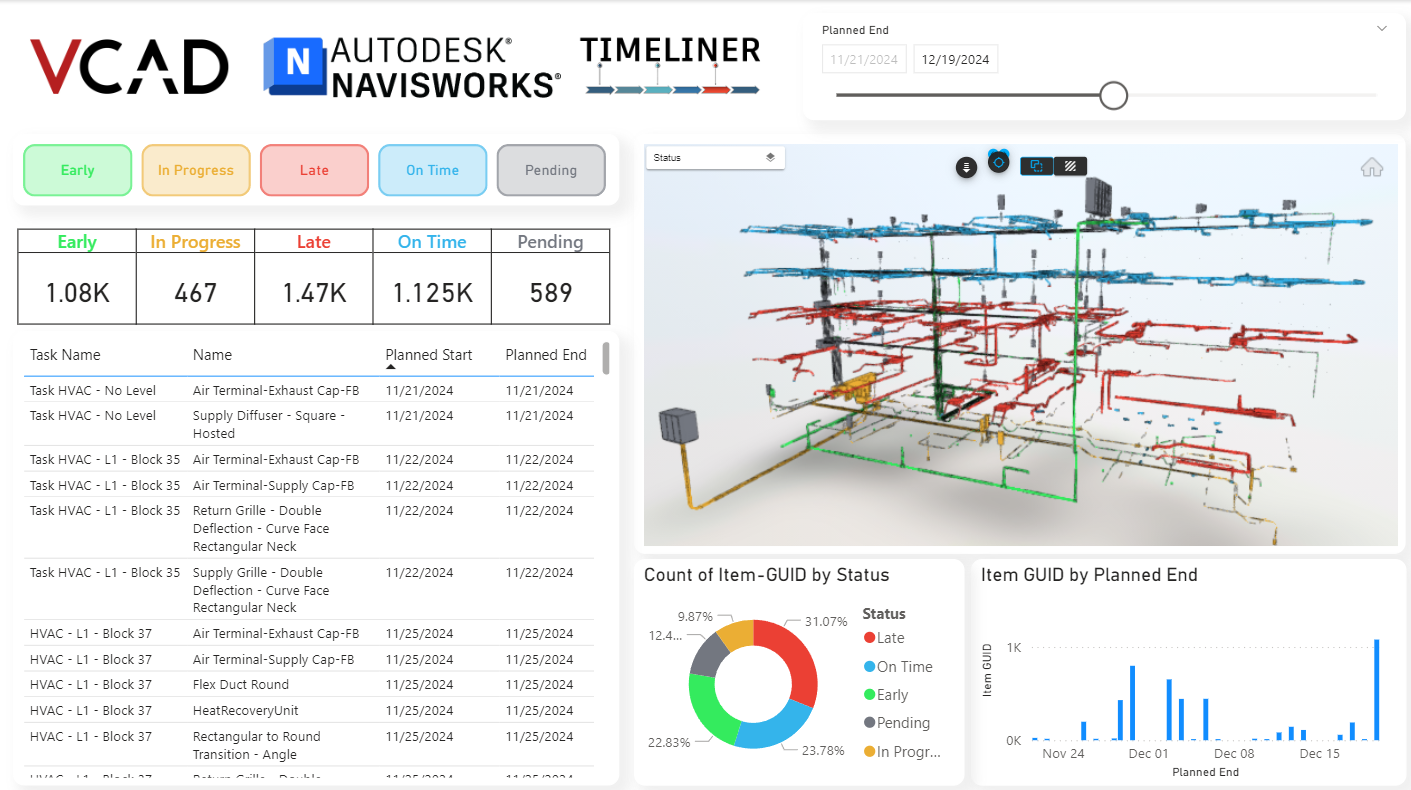
On top of the base model, VCAD supports two common Navisworks workflows directly in Power BI. Clash detection results can be brought into a report where each clash is filterable by test, status or assigned team member, with the clash marker shown on the model. TimeLiner task schedules can be linked to the elements they affect, so progress and sequencing become part of the same report.
Full setup steps are in our dedicated guides: clash detection in Power BI and TimeLiner in Power BI.
Why bring Navisworks data into Power BI
Bringing the data into Power BI makes it accessible to people who never open Navisworks: site managers, coordination teams, clients. Reports refresh, are shared and published like any other Power BI content, but stay connected to the real model. The data is no longer locked inside the coordination software, it becomes a basis for making decisions.
Try it on your model
The best way to understand what VCAD can do with your Navisworks files is to see it on your own data. Book a demo with our team and we will show you the full workflow, from importing the model to the report in Power BI.