How to build a construction progress simulation in Power BI, starting from an IFC model converted with VCAD and a construction schedule.
What it is
4D is the simulation of construction progress on the three-dimensional model: pick a date and the model shows what has already been built, what is being worked on and what has not yet started.
VCAD converts the IFC into tabular data. The model’s objects become rows with their properties and can be related to other tables, including a construction schedule. The simulation is therefore built in Power BI, with the same tools used for the company’s other reports, and viewed in the same place.
The advantages of this approach:
- the simulation uses the data already converted for the other reports, with no second database;
- the link between model and schedule is based on the object identifier and rebuilds itself on every refresh;
- the 3D model sits next to the numbers: progress, earned value and open work packages on the same page;
- anyone who reads the company reports also sees the simulation, with no additional tools;
- the setup can be reused on other models by replacing the data.
The role of VCAD
VCAD comes in at three points of the workflow.
The conversion. With vcadextract, the IFC model is turned into a set of tables: the objects, their properties and the floors they belong to. The IFC’s quantities and property sets become rows that Power BI reads like any other data source. Among the properties is the object identifier, which is what makes the link to the schedule possible.
The template. The Power BI report starts from a template already connected to the converted project. The model tables, their relationships and the 3D visual are already in place; the work consists of adding the schedule and the progress measures.
The 3D visual. This is the component that makes the simulation visible. It receives an identifier and a color for each object and paints the model accordingly. It can also make the objects outside the selection transparent, which is what lets the building appear progressively. Without this component the result would be a table of statuses, not a simulation.
The same converted model also serves the other reports normally built on VCAD, such as those on quantities, properties and materials. 4D needs neither a second conversion nor a second database: it is a further use of the same tables.
The sample model
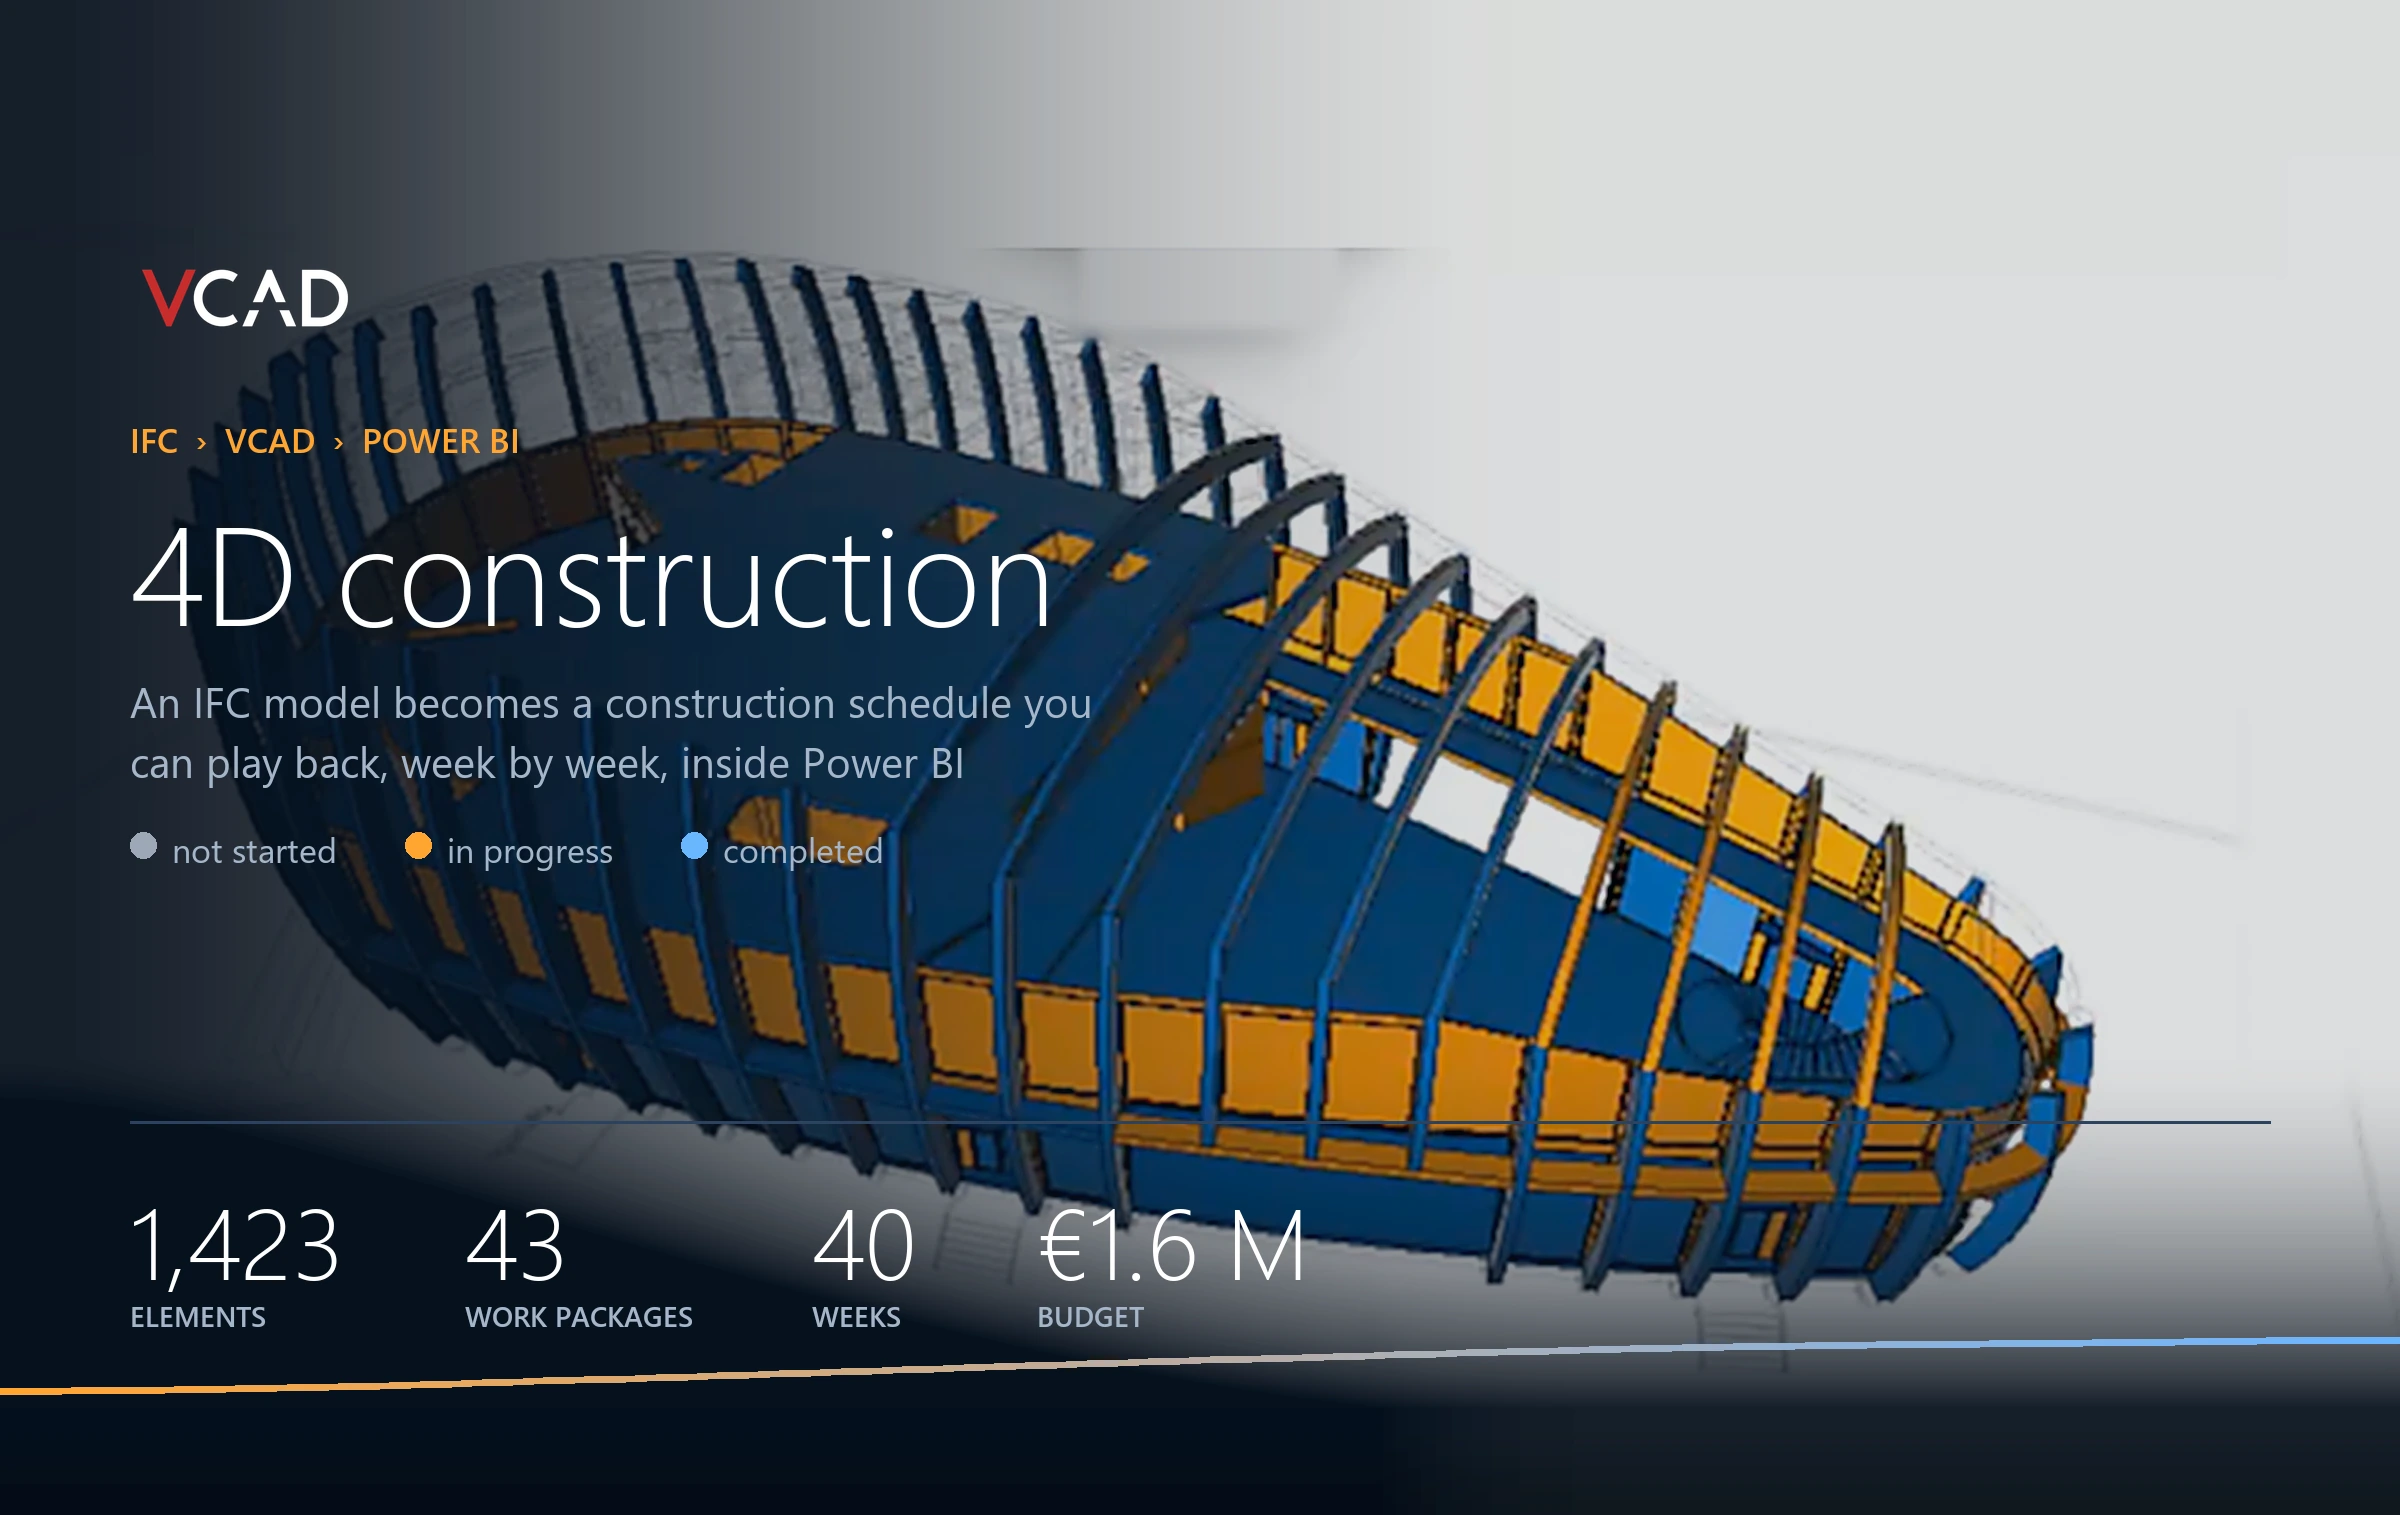
The numbers and images in this article refer to a pavilion used as a demonstration model: a building on several levels, exported to IFC and converted with VCAD. It contains 1,423 objects with geometry, mostly walls, windows, doors, beams and columns. The schedule generated for the example divides it into 43 work packages over 40 weeks, for a simulated total value of about €1.6 million.
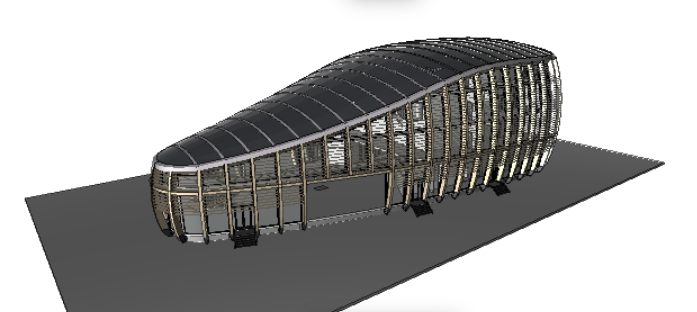
The sample model in the 3D visual, with its original materials.
How model and schedule are linked
Each object in the model has a class, a floor and its own quantities. Each work package in the schedule has a trade, a start date and a finish date. The two are linked through the identifier the IFC assigns to every object, which stays the same from one revision of the model to the next.
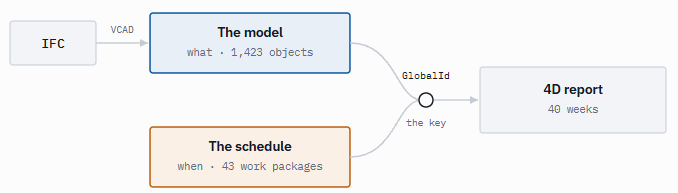
The model and the schedule remain two separate sources, joined by the object identifier. The link is rebuilt on every refresh of the report.
Where the schedule comes from
The construction schedule is not part of the IFC and has to come from elsewhere. There are three options:
- a real schedule exported from Project or Primavera, with a work package code attached to each activity;
- a parameter filled in during modeling, carrying the work package code directly on the objects;
- a schedule generated by rules from the structure of the model: foundations, structure, walls, envelope, windows and doors, MEP and finishes, with durations proportional to quantities and floors staggered against each other.
The third was used for this example, because it needs no preparation and applies to any model. The dates and costs shown are therefore simulated: they demonstrate the mechanism and have no planning value.
What you see
When a week is selected, the model is colored by the status of each object: transparent if work has not started, orange if it is in progress, blue if it is complete. With automatic playback the weeks run on and the building is built up progressively.
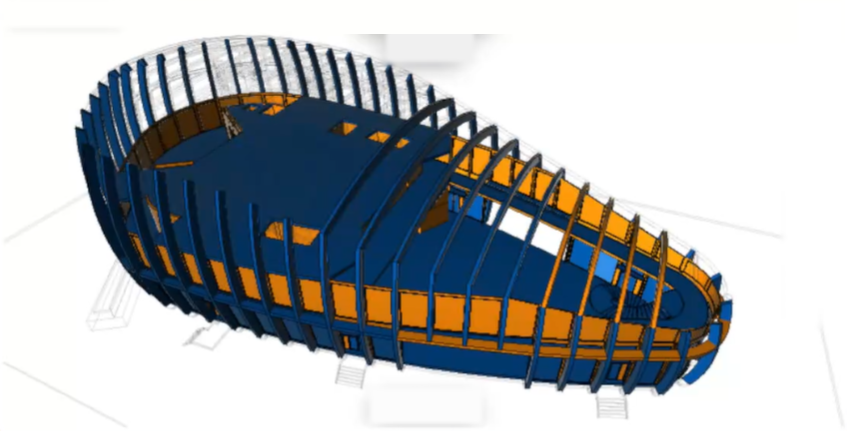
Week 15: completed work in blue, work in progress in orange, work not yet started shown transparent.
Next to the model, the same data is shown as numbers: earned value against plan, the work packages open in each week and the progress of each trade.
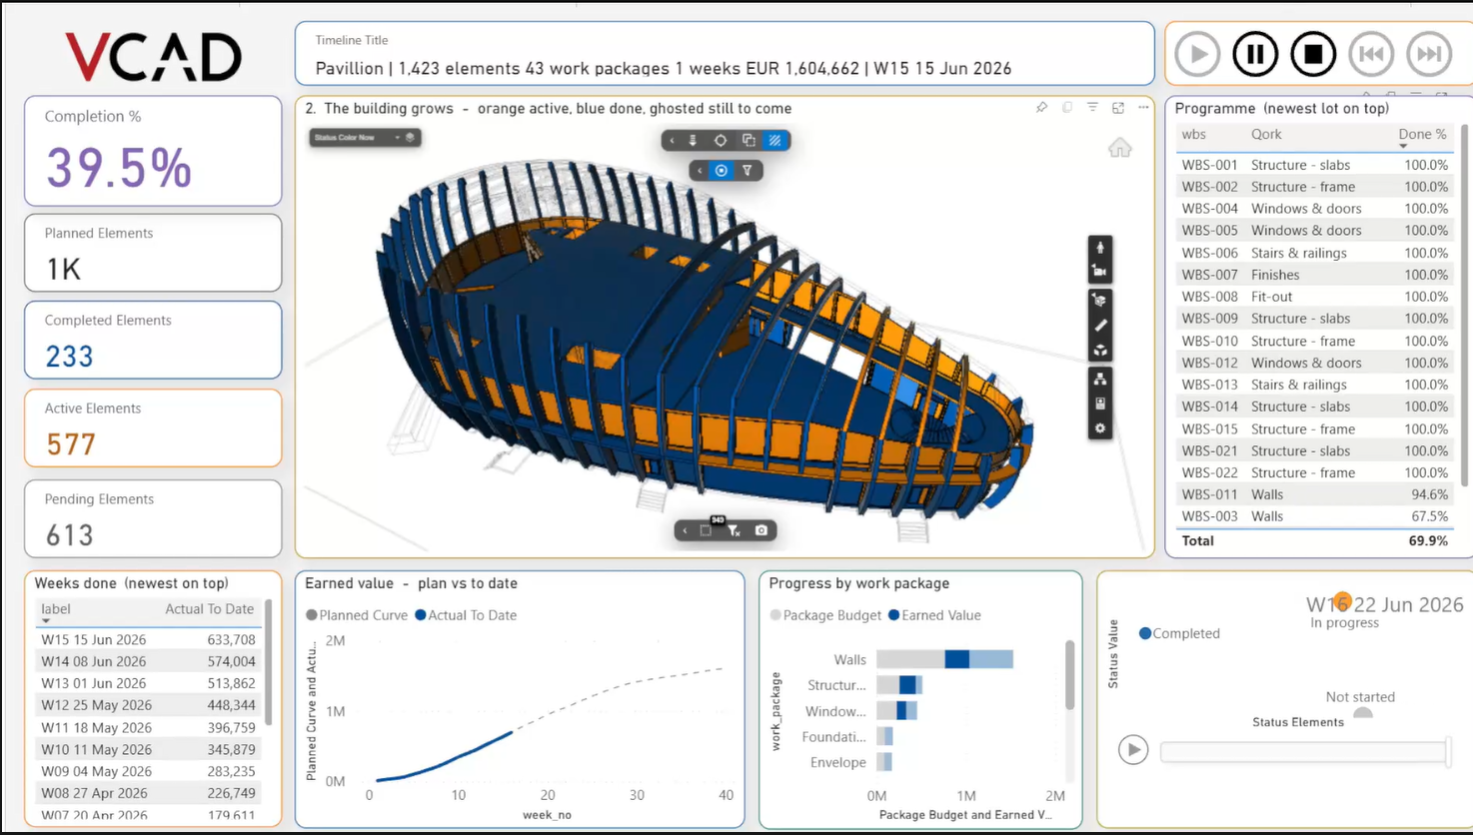
The report page at week 15. Progress indicators on the left, the model in the center, open work packages on the right; below, the earned value curve and the playback controls.
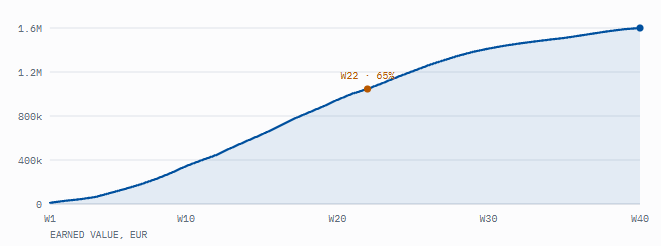
Earned value by week. The curve is slow in the first weeks, when a few crews are working on the foundations, and steeper in the middle phase, when several trades run in parallel on different floors.
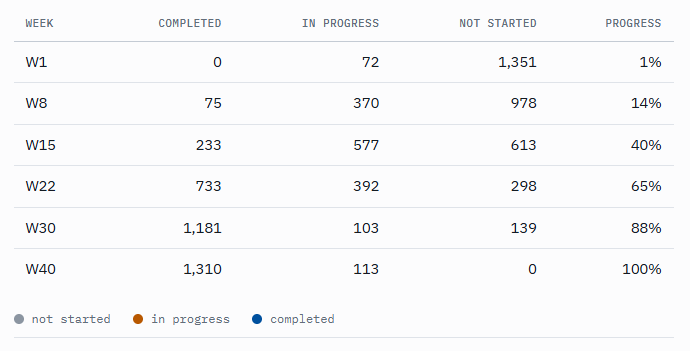
Legend: not started, in progress, completed.
Updating the model
The link between schedule and model comes from the identifier contained in the IFC. When the design is revised, it is enough to reconvert the file and refresh the report: the schedule stays attached to the corresponding objects, while newly added objects show up with no work package assigned and are therefore easy to spot.
Recommended check
Make sure every object in the model falls within a work package. Objects left out stay transparent for the whole simulation, and the error only shows in the last frame. In the sample model it affected 8% of the objects.
What you need
- an IFC model uploaded to VCAD and converted with vcadextract;
- the VCAD Power BI template connected to the project;
- a construction schedule, in one of the three forms described above;
- a visual for automatic week-by-week playback, available free in the Power BI marketplace.
Everything happens in Power BI, on the license already in use. The report setup is reusable: once configured on one model, it applies to others by replacing the data.