The window to floor area ratio is one of the first checks a residential project has to pass: in many building codes, Italy’s among them, a room is habitable only if its glazed area is at least one eighth of its floor area. This article shows how to run that check on a BIM model in Power BI, floor by floor, with the results shown directly on the 3D model.
What the window to floor area ratio is
The rule compares two quantities: the glazed area serving a room and the floor area of that room. When the first is below one eighth of the second, the room does not meet the minimum daylight and ventilation requirement and cannot be classified as habitable. The same principle appears, with different thresholds, in most national building codes.
The arithmetic is trivial. What makes the check slow is collecting the numbers. Window areas live in one schedule, room areas in another, and matching them means going level by level, revision by revision. On a sixteen storey building that is an afternoon of work, and it has to be redone every time the facade changes.
Running the check on the model instead of the schedules
Everything the check needs is already in the BIM model. Openings carry their area, rooms carry their floor area and their use, and both carry the level they belong to. The only missing step is turning that geometry into data that can be summed, divided and compared against a threshold.
That is what Vcad does. The model is converted into tables, the tables are read by Power BI, and the ratio becomes a measure like any other, recalculated at every refresh.
The conversion
The model is converted into a set of tables: the openings with their areas, the floors with their areas, and the level each object belongs to. No plugin in the authoring software, no export by hand.
The Power BI template
The report starts from a Vcad template already connected to the converted project, with the model tables, their relationships and the 3D visual in place. What gets added is the ratio measure and the threshold.
The 3D visual
This is what turns a column of percentages into something you can point at. Openings and floors are colored by the result of their level, so a level below the limit is visible on the building itself and not only in a cell of a table.
The sample model
The figures in this article come from a residential building used as a demonstration model: 16 levels, 105 units, 371 openings, 2,674.8 m² of glazing over 10,382.7 m² of floor area, for an overall ratio of 1 : 3.9.
How glazed area and floor area are matched
Each opening carries an area and belongs to a level, and so does each floor area. The ratio of a level is its total glazed area divided by its total floor area, compared against the one eighth threshold. The report also breaks each level down by unit, so a level with ten apartments shows both its overall ratio and the glazed area available per unit.
What the check measures, and what it does not
This report works at level granularity, on the gross floor area of each level. Building codes apply the rule to individual habitable rooms, so a level computed on gross area is by definition more severe than the same check run on habitable area alone. A level that passes here will almost certainly pass the detailed check, and a level that fails is where to look first.
What the report shows
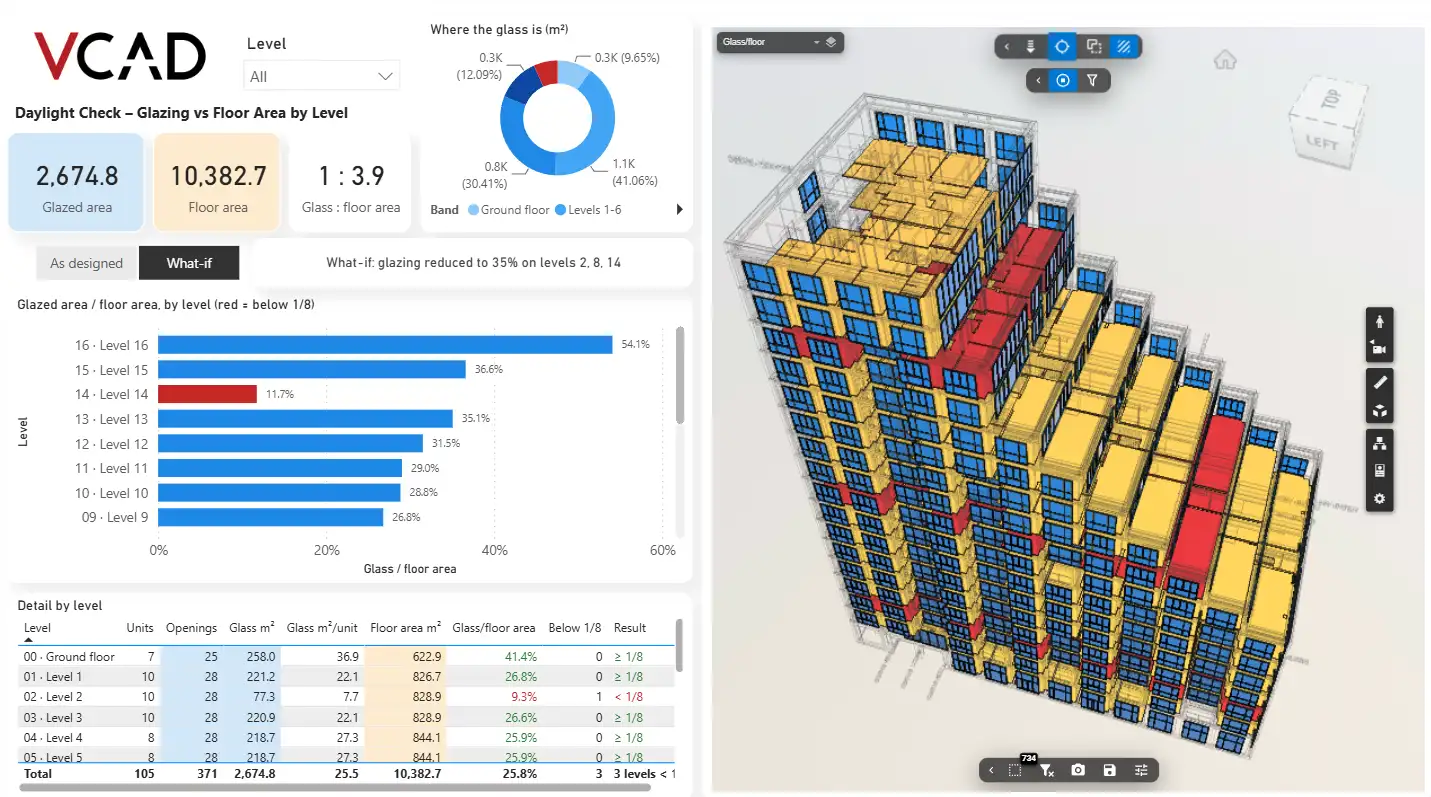
Three cards give the totals: glazed area, floor area and the resulting ratio. A donut shows where the glass actually is, grouped by band of levels. A bar chart ranks every level, with red bars for the ones below one eighth. The table below repeats the same data as numbers.
| Level | Units | Openings | Glazed area m² | Gross floor area m² | Ratio | Result |
|---|---|---|---|---|---|---|
| 00 Ground floor | 7 | 25 | 258.0 | 622.9 | 41.4% | ≥ 1/8 |
| 01 Level 1 | 10 | 28 | 221.2 | 826.7 | 26.8% | ≥ 1/8 |
| 02 Level 2 | 10 | 28 | 77.3 | 828.9 | 9.3% | < 1/8 |
| 03 Level 3 | 10 | 28 | 220.9 | 828.9 | 26.6% | ≥ 1/8 |
| 14 Level 14 | 4 | 14 | 40.1 | 341.8 | 11.7% | < 1/8 |
| 16 Level 16 | 2 | 12 | 98.8 | 182.6 | 54.1% | ≥ 1/8 |
| All 16 levels | 105 | 371 | 2,674.8 | 10,382.7 | 25.8% |
Six levels from the sample model, shown as an example. Values in red are below the one eighth threshold.
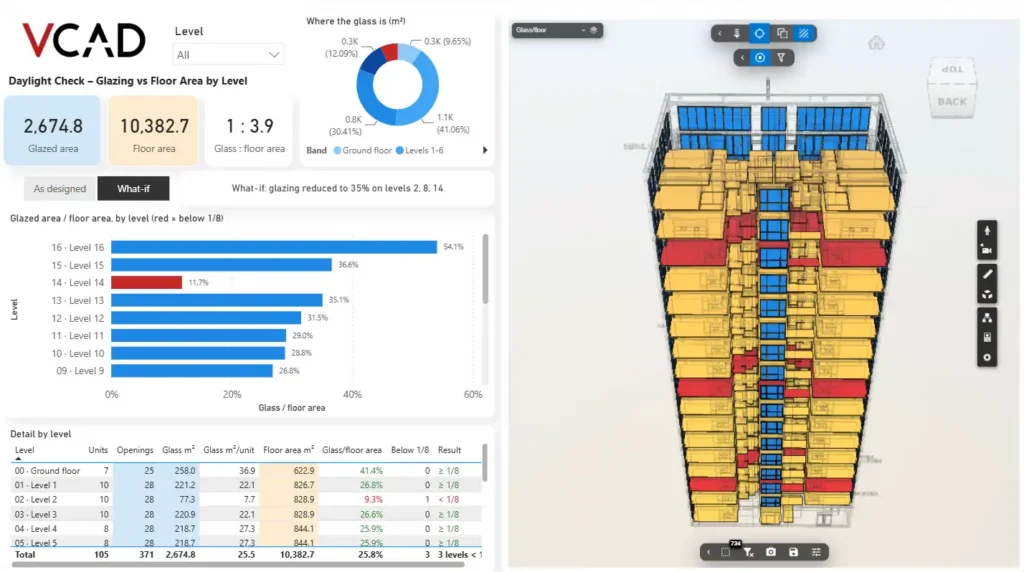
The whole building colored by result. The levels below one eighth stand out without opening the table.
From the whole building down to a single level
Clicking a level filters everything at once: cards, donut, table and 3D model. The building isolates that level and the totals recalculate on it alone, so a level flagged in red can be inspected on its own, unit by unit and opening by opening.
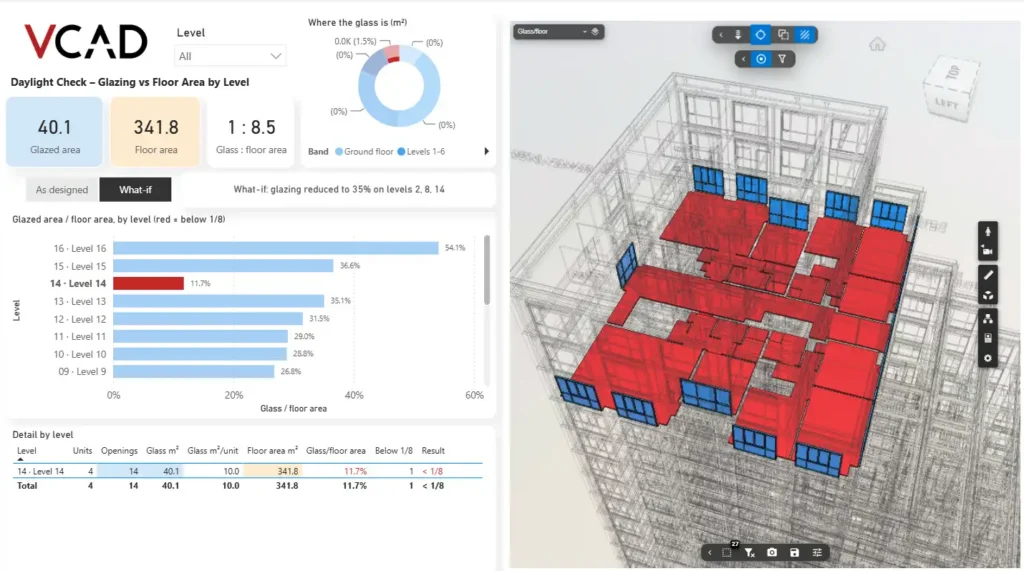
Level 14 isolated: four units, 14 openings, 40.1 m² of glass against 341.8 m² of floor area. A ratio of 1 : 8.5, below the limit.
Testing a design change before you make it
The report has two modes. “As designed” shows the model as it stands. “What-if” applies a change to the glazing and recalculates the whole check against it. In the scenario shown here, the glazing on levels 2, 8 and 14 is reduced to 35% of the designed value, and those three levels fall below the threshold.
This answers the question that usually arrives late in a project, when a facade is being simplified or a window schedule is being cut to save cost: which levels stop complying if we do this. Answering it on the model takes seconds instead of a day of recalculation.
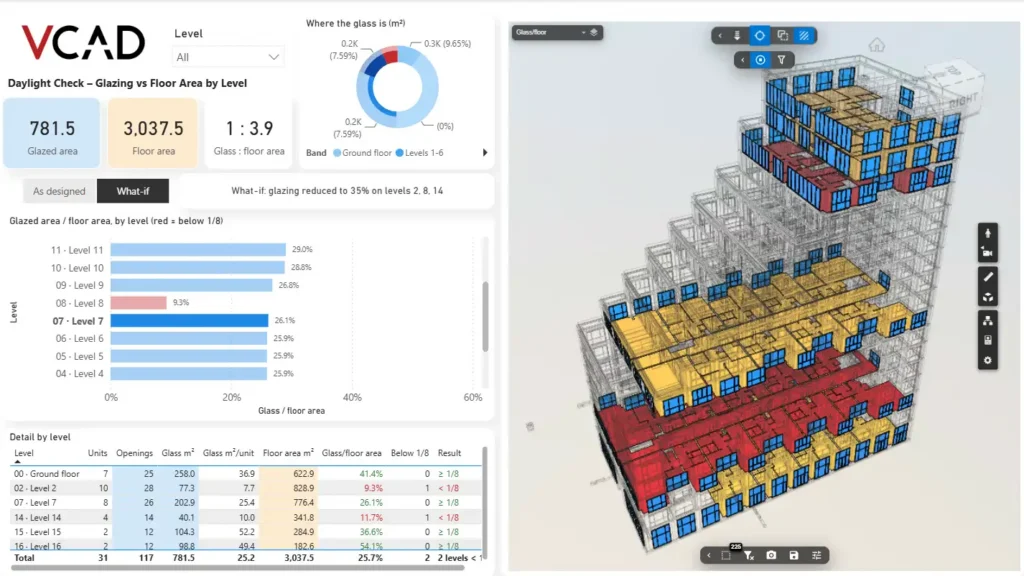
Several levels compared at once. The selection drives both the charts and the 3D model.
Keeping the check up to date
When the design changes, reconvert the file and refresh the report. New openings and new floor areas come in with it, so the check always reflects the current revision without being rebuilt.
What you need
- an IFC or Revit model uploaded to Vcad and converted;
- levels and floor areas correctly set in the model;
- the Vcad Power BI template connected to the project;
- a Power BI license, the one your team already uses.
Everything happens inside Power BI. The setup is reusable: configured once on a model, it applies to the next one by replacing the data, and the same logic works for any check that compares two quantities against a threshold.
See it in practice
Explore other reports built with Vcad on our Power BI examples page, or see how the same approach is used for construction progress simulation and for maintenance data on the model.
You can sign up and try Vcad, or request a demo.
FAQ
It is the ratio between the glazed area serving a room and the floor area of that room. Most building codes require it to be at least one eighth for a room to be considered habitable, as a minimum condition for daylight and natural ventilation.
Yes. Openings and rooms already carry their areas and their level. Once the model is converted into tabular data with Vcad, the ratio is a calculation in Power BI that updates at every refresh, with no manual matching between window and room schedules.
Both. Vcad converts IFC as well as Revit, Navisworks and DWG, so the check does not depend on the authoring software used to produce the model.
Level by level, on the gross floor area of each level. That is enough to compare levels, track a design change and spot what is at risk, and it is a conservative result. To compute the ratio room by room, each opening needs to carry a reference to the room it serves.
Yes. The what-if mode applies a change to the glazed area and recalculates the whole check against it, so you can see which levels would stop complying before touching the design.